A. Introduction
The last lecture gave an introduction into protein sequences (or primary structures), and we have learnt which information can be extracted on the sequence level. In short, these include:
- Identification of conserved (and possibly functionally or structurally essential residues), by alignment with related sequences
- Prediction of phylogenetic trees, by alignment with related sequences
- Protein function prediction (when a homologue with known function is annotated)
In another lecture, we will learn that sequences can, in addition, be used for structure prediction:
- Secondary structure prediction (from the amino-acid propensities in the sequence)
- Tertiary structure prediction (when a homologue’s structure is known)
Today, we will focus on the first aspects, as prediction will follow later. First we will analyse the peptide hormone insulin.
B. Multiple sequence alignment of insulin
As you may know, insulin is essential for normal metabolism, as it stimulates glucose uptake after a meal. Malfunction of insulin leads to diabetes, which is characterized by decreased glucose tolerance resulting from a relative deficiency of insulin (or, alternatively, a lack of sensitivity to insulin on the receptor side). If you are interested in more information on insulin you can have a look here.
For a sequence analysis of insulin, we obviously first need its sequence. For this, we visit the UniProt database, and search for insulin. As you will see, there are thousands of matches to insulin from various animals and to “insulin-like” proteins, but finding the actual human insulin is tedious. This is (partly) because on the sequence level, insulin is stored as a precursor. After synthesis, the precursor protein is then split into the A and B chain that together form the active form of insulin. Thus, we select the sequence of the human insulin precursor: INS_HUMAN (P01308).
The UniProtKB entry of human insulin contains loads of useful information, that you may browse using the blue menu on the left. It starts with some general information on the sequence, starting with basic entry information, the name and origin of the protein. Then follow several sections, where you can find different information about the protein, such as Diseases & Variants where we find a number of natural mutations associated with different forms of diabetes.
From the PTM / Processing section, we can learn how the precursor sequence is related to the active form of the hormone: the first 24 residues are a signal sequence, followed by a stretch of 30 residues (25–54) that corresponds to the B chain of insulin, and residues 90–110 make up the A chain. There are also cross-references to other databases concerning insulin, like for example the Protein Data Bank in the section Structure, where many X-ray and NMR structures of insulin are listed.
Finally, the Sequence & Isoforms section at the bottom of the page contains the actual sequence. To retrieve it in FASTA format, click Download. This is the sequence as we will feed it to BLAST. Prepare it for copy-and-paste to the BLAST window by selecting the sequence with the mouse.
BLAST stands for “Basic Local Alignment Search Tool”, and represents a set of algorithms for comparing a given sequence with sequences in a database
Now we open a new browser window to run BLAST. You can access the tool via UniProt by clicking on BLAST in the header bar at the top of the page. Paste your sequence into the input box and run BLAST with the default parameters. After some time, you obtain the 250 database sequences closest to the human insulin (precursor), sorted by their level of similarity.
Question: Insulin from which animals is most similar to human insulin (see the organism names)? Is the result surprising?
To retrieve the sequences in FASTA format, select all sequences by checking the box next to Entry, then click Add next to the basket symbol. Navigate to your Basket (top right of the UniProt page), click Download, select Format → FASTA (canonical) and Compressed → No. We are now presented with the raw sequences. Copy all sequences, and open a new browser window at the European Bioinformatics Institute (EBI) from which we will run the multiple alignment server.
Question: Using BLAST, the selected sequences have already been aligned, to assess the similarity to our target sequence. Why do we need to do another alignment?
💡 Using BLAST, all sequences were aligned to the target structure. To determine the overall optimal alignment, however, all sequences should be aligned to each other. Therefore, to determine conserved residues or (phylo)genetic information, we cannot use the BLAST alignment, but have to use a specialised alignment method like Clustal.
On the Services site of the EBI, click on Sequence analysis, then click Multiple Sequence Alignment → Clustal Omega. Paste your sequences in the window and run Clustal Omega with the default parameters. Depending on the load on the server, Clustal Omega will take a while to complete.
To get a detailed view of the alignment we can use JalviewJS. Open the browser version by clicking on Desktop view of JalviewJS. You can load the alignment with a URL from the results page of the Multiple Sequence Alignment on EBI. Click on the tab Results Viewers, you will find a link, which you can use to open the results in Jalview, as described in the instructions under Jalview → How to view the resulting MSA with Jalview in the Results Viewerstab. Now, let us highlight conserved residues using JalviewJS. First apply a colour scheme via Colour → Taylor. The Taylor scheme assigns each amino acid a unique colour based on its physicochemical properties, making it easy to spot which residue types are preserved across species. Then select Colour → By Conservation. With Colour → Modify conservation threshold... we can modify the intensity of these colours: the most conserved columns will appear in the most vivid colours, while poorly conserved positions fade to pale. Feel free to also try other base colour schemes such as Hydrophobicity (which colours hydrophobic residues red and hydrophilic ones blue).
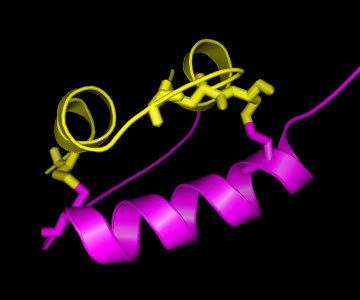
Question: Which are the most conserved residues? Why might these residues be conserved? All cysteine (C) residues seem highly conserved. What might be the reason?
As can be seen in the structure, there are two “bridges” connecting the A and the B chain, formed by Cysteine (C) residues on both chains. This is an important structural feature of insulin, strongly stabilising the structure. Therefore, it can be easily understood that these C residues are among the strongly conserved residues in the hormone. As is known from other structural studies, residues interacting with the insulin receptor include: the N-terminus of the A-chain (G-I-V-E), the C-terminus of the A-chain (Y-C-N), and the C-terminus of the B-chain (G-F-F-Y), so also for these residues there is a clear reason for their conservation. For the other conserved residues, the reason for their conservation is less clear, although their mutation has shown altered activity, hence indicating a functional role.
C. Phylogenetic analysis of hemoglobin
Another application of multiple sequence analyses is the derivation of evolutionary information, in particular the analysis of common ancestors among different species, and their grouping (also known as taxonomy) based on sequence similarity. This analysis is known as phylogenetic analysis, and trees representing the sequence relationships are known as phylogenetic trees.
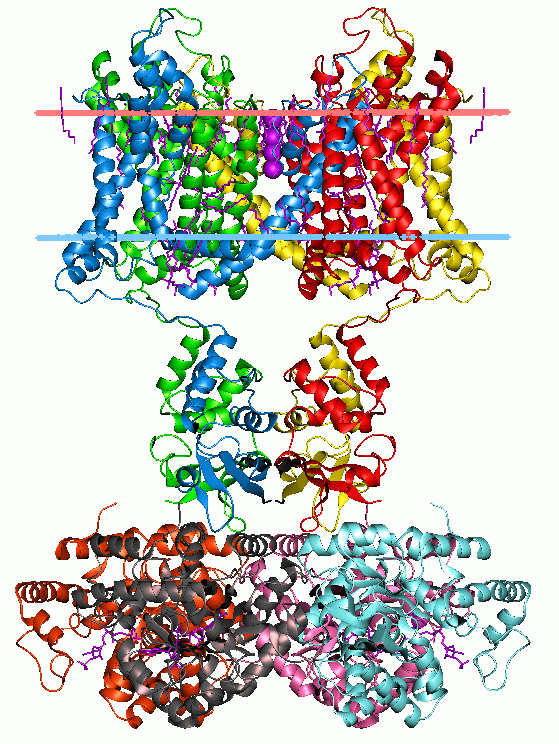
In this course we will generate two phylogenetic trees, and compare the results, to see if the mutational pattern in the one protein (and the associated phylogenetic tree) is similar to that of the other. For this we will take the alpha and beta chain of hemoglobin. Hemoglobin is the universal oxygen transporter in nature. It takes up oxygen in the lungs (or gills for fish) and transports it via the blood in red blood cells to the brain, muscle, or other destinations in the body where oxygen is required. In fact, the reason why blood is coloured red is because of the hemoglobin. Hemoglobin contains iron, which in that particular state is coloured red, not unlike rust. Although part of the same protein, the two sequences of the alpha and beta chain have evolved independently, and hence, two separate phylogenetic trees can be constructed.
For the sequence retrieval, we follow the same procedure as we have done above for insulin, first for the human hemoglobin alpha chain (search for human hemoglobin alpha), and then for the hemoglobin beta chain. The sequence to select for the alpha chain is HBA_HUMAN (P69905), for the beta chain it is HBB_HUMAN (P68871).
In the BLAST results, select Status → Reviewed (SWISS-PROT) and then select only the sequences that start with HBA and HBB, respectively (i.e. no HBD, HBA1 or HBA2, etc.); the easiest way to do this is to select all sequences and then deselect the unwanted ones. Download the sequences following the same procedure as we have done above for insulin. Paste the sequences into the Clustal Omega window and submit. After some computation time, the EBI server will show the results and you can find the tree under the tab Phylogenetic Tree. You can find the phylogram in the lower half of the results window. In a phylogram, the horizontal branch lengths are proportional to the evolutionary distance between sequences: the longer a branch, the more that sequence has diverged from the common ancestor. This gives a visual indication of how much time has passed since two lineages split apart. Keep the Clustal Omega window for the alpha chain open and repeat the procedure for the beta chain.
Questions:
- Which species are most similar to human?
Hint
💡 The species information is encoded in the entry name of each FASTA header. For example, in sp|P68871|HBB_HUMAN, the last five characters after the underscore (HUMAN) is the UniProt’s organism code. To look up an unfamiliar code, search for it in the UniProt taxonomy browser.
- Some species show zero horizontal distance to humans in the phylogram. What does this mean?
Hint
Compare the hemoglobin sequence of hemoglobin for Chimpanzee and human.
- How related are humans to White rhinoceros (CERSI), and the harbor seal (PHOVI)?
- How does this example illustrate that it is dangerous to derive a phylogenetic tree from the sequences of a single protein?
Hint
💡 Carefully look at the positions of the black-headed spider monkey (ATEGE) and the moustached tamarin (SAGMY).
D. Optional exercises
Protein Domains
Protein function typically results from modular structural features called Domains. Due to evolutionary shuffling, these domains may be conserved in proteins that share similar function. Domains can be used for classifying proteins into families that display structural and sequence similarities within conserved regions of the protein. Pfam is an online database of proteins that contains a large set of Multiple Sequence Alignments of protein domains.
Given some sequence or protein ID, Pfam reports:
- Similarities with highly characterized protein MSAs with known functions
- Similarities with all the other MSAs that are poorly characterized
Using the link provided to the Pfam website, search for the keyword Q12809 using the Jump to option. Try to answer the following questions:
Questions:
- Is the structure of this protein known?
- What Pfam families are present in the protein?
- Do you think that these domains are structurally related?
- It is easy to identify the function of the domains. Can you guess how they interact to result in the protein function? Is it possible that the protein has more than one function?
Reproducibility
If time allows, build a phylogenetic tree of a very different protein (like a ribosomal elongation factor or F1-ATPase) and compare the result to that of hemoglobin.
Further references
Books:
- Editor: J. M. Keith, Bioinformatics: Volume I Data, Sequence Analysis and Evolution, Springer Series in Methods in Molecular Biology, Vol. 452. [link]
Advanced reading: